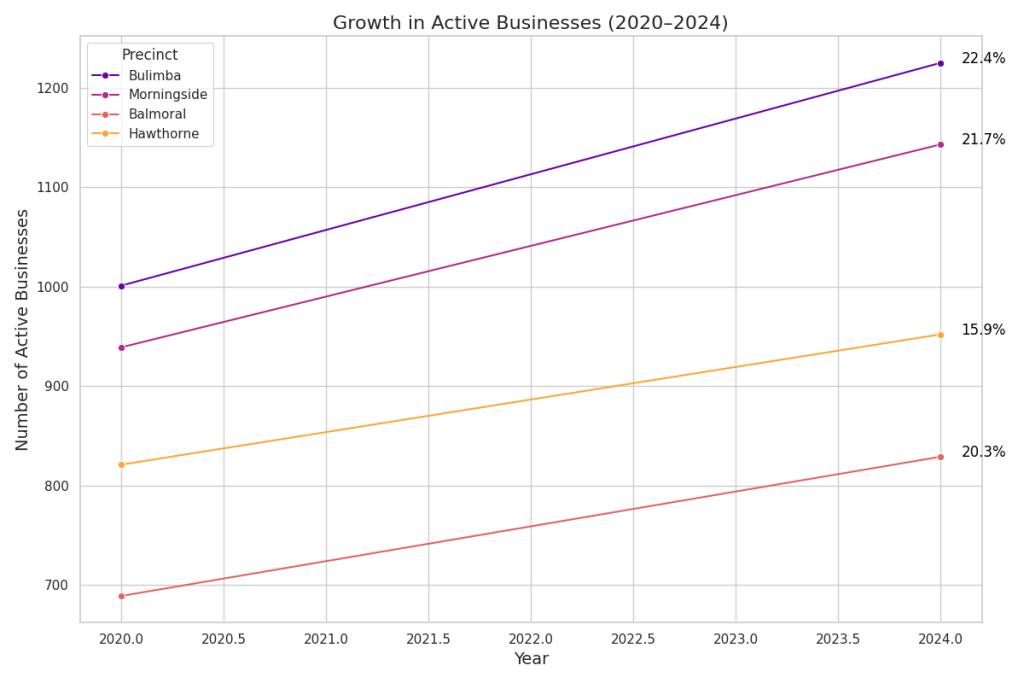
Across Bulimba, Hawthorne, Balmoral and Morningside, the period from June 2020 to June 2024 saw a clear upswing in small business activity. Bulimba led in scale, growing from 1,001 to 1,225 active businesses (a 22.4% rise), closely followed by Morningside’s 21.7% uplift to 1,143 enterprises. Balmoral recorded a 20.3% gain, climbing to 829 businesses, while Hawthorne grew more modestly by 15.9% to 952.
Year-on-year data reveal steady expansion across every suburb. Bulimba and Morningside each averaged just over 5% annual growth, Balmoral around 4.7%, and Hawthorne 4%. This consistency points to both resilient new-business formation and strong retention of existing operators, even amid shifting market conditions.
Industry composition is remarkably similar across the four areas, with Professional, Scientific and Technical Services topping the list in each. In June 2024, that sector alone accounted for roughly 18–19% of businesses in Bulimba, Hawthorne, Balmoral and Morningside. Retail Trade, Accommodation and Food Services, Health Care and Social Assistance, and Construction also feature among the top five in all precincts, collectively representing 58–67% of local enterprises. Morningside stands out for its significant Manufacturing presence, while the other suburbs skew more heavily toward consumer-facing and knowledge-based services.
Taken together, these figures tell a story of vibrant, service-oriented economies underpinned by professional expertise and hospitality. Steady growth rates and broad industry diversity suggest that each suburb has carved out a distinctive niche—yet all share a foundation of small and medium enterprises driving local employment, community vibrancy and ongoing precinct renewal.
In June 2024, Bulimba recorded 1,225 actively trading businesses, up from 1,001 in June 2020. This represents a 22.4% increase over the four-year period, reflecting strong local entrepreneurial activity and sustained demand for goods and services in the precinct.
The count of active businesses rose steadily each year: from 1,001 in 2020 to 1,043 in 2021, then to 1,095 in 2022, 1,157 in 2023, and finally 1,225 in 2024. This trajectory equates to an average annual growth rate of approximately 5.1%, underscoring continuous expansion in Bulimba’s economic base.
As of June 2024, the leading industry by business count was Professional, Scientific and Technical Services with 228 establishments, followed by Retail Trade (193), Accommodation and Food Services (152), Health Care and Social Assistance (143), and Construction (135). Other notable sectors included Financial and Insurance Services (89), Education and Training (74), Other Services (65), Administrative and Support Services (63), and Wholesale Trade (58). Together, the top five industries account for nearly 60% of all active businesses in Bulimba.
In June 2024, Hawthorne recorded 952 actively trading businesses, up from 821 in June 2020. This represents a 15.9% increase over the four-year period, highlighting solid local entrepreneurial growth and sustained demand for goods and services in the suburb.
The count of active businesses rose steadily each year: from 821 in 2020 to 846 in 2021, then 879 in 2022, 914 in 2023 and 952 in 2024. This trend corresponds to an average annual growth rate of approximately 4.0%, reflecting consistent business formation and retention in Hawthorne’s economic landscape.
By industry, Professional, Scientific and Technical Services led the Hawthorne economy in June 2024 with 167 businesses, followed by Retail Trade (137), Construction (125), Health Care and Social Assistance (114) and Accommodation and Food Services (97). Together, these top five industries account for 67.2% of all active businesses in the suburb. Other notable sectors include Other Services (48), Education and Training (38), Financial and Insurance Services (36), Administrative and Support Services (35) and Wholesale Trade (25).
In June 2024, Balmoral recorded 829 actively trading businesses, up from 689 in June 2020. This 20.3% increase over four years highlights rising entrepreneurial activity and sustained demand for local goods and services in the suburb.
Active businesses climbed steadily each year: from 689 in 2020 to 715 in 2021, then to 748 in 2022, 785 in 2023 and 829 in 2024. This trajectory equates to an average annual growth rate of about 4.7%, underscoring consistent expansion in Balmoral’s economic base.
By industry, Professional, Scientific and Technical Services led Balmoral’s economy in June 2024 with 154 businesses, followed by Retail Trade (128), Health Care and Social Assistance (103), Accommodation and Food Services (98) and Construction (92). These top five sectors alone account for nearly 70% of all active businesses in the suburb. Other notable industries include Other Services (52), Financial and Insurance Services (48), Education and Training (45), Administrative and Support Services (42) and Wholesale Trade (38).
In June 2024, Morningside supported 1 143 actively trading businesses, up from 939 in June 2020. This 21.7 percent increase over four years reflects strong local enterprise growth amid steady demand for both consumer and industrial services in the suburb.
The number of active businesses climbed year by year, from 939 in 2020 to 972 in 2021, then to 1 017 in 2022, 1 077 in 2023, and finally 1 143 in 2024. That trajectory represents an average annual growth rate of about 5.2 percent, pointing to sustained new business formation and retention in Morningside’s economy.
By industry, the largest sector in June 2024 was Professional, Scientific and Technical Services with 202 businesses, followed by Manufacturing (167), Construction (149), Retail Trade (142) and Accommodation and Food Services (122). Those top five industries alone account for 57.7 percent of all active businesses in Morningside, underscoring the precinct’s mix of knowledge-based firms, light industrial operations and consumer-facing outlets.
The next five industry sectors by business count were Health Care and Social Assistance (94), Wholesale Trade (86), Transport, Postal and Warehousing (72), Administrative and Support Services (68) and Financial and Insurance Services (64), rounding out the top ten and illustrating the suburb’s diversified economic base.
Content: Oxford Street Bulimba Marketing
Reference: www.abs.gov.au